Technologies for sequencing nucleotide molecules like DNA or RNA have exploded in diversity over recent decades. They have become more powerful in terms of accuracy and speed. They have become far cheaper as well. This has resulted in researchers being able to generate large amounts of sequencing data with relative ease, but that data can have certain limitations built into it. For instance, many platforms can struggle when attempting to sequence large stretches of repetitive DNA. Also, the size of the individual DNA fragments being sequenced can hinder high-confidence interpretation of structural rearrangements, resulting in different outcomes based on which alignment algorithms are used. As such, an unrelated, orthogonal method which is not based on sequencing is sometimes employed to assay the same sample and generate a comparative data set. Here, we will compare a few of the options available for this aim.
G-Banded Karyotyping
G-Bands are generated via chemical staining based on the relative proportion of each of the four DNA bases in a chromosomal region. While the resolution of this method is millions of times poorer than sequencing, it has several advantages which explain why it has been a gold standard for decades. Karyotypes allow a user to directly see the chromosomes. Sequencing offers no way to visually double-check a given result. Also, karyotyping data is generated from single cells, one at a time. While single-cell sequencing has existed for some time, it can be relatively costly, laborious and time-consuming with results of variable quality. Much of sequencing data comes from pooled samples. Pooling can make it harder to detect low-prevalence variants. For abnormalities large enough to see in a karyotype, G-banding can mitigate a lot of these issues, especially if a high enough number of cells is analyzed, as with KromaTiD’s Genomic Integrity Karyotyping, offering target numbers in the hundreds.
mFISH Karyotyping
multicolor Fluorescence In Situ Hybridization (mFISH) employs combinations of differently labeled FISH probes to enable software to paint each chromosome with a unique false-color. Whereas G-banding distinguishes chromosomes with signature banding pattern, mFISH paints each a different color. The lower limit of detection of mFISH is on the order of 100 kilobases, compared to 10 Mb for G-banding. However, inversions not involving the centromere (paracentric inversions) are very challenging to detect in a solid-stained object.
dGH SCREEN
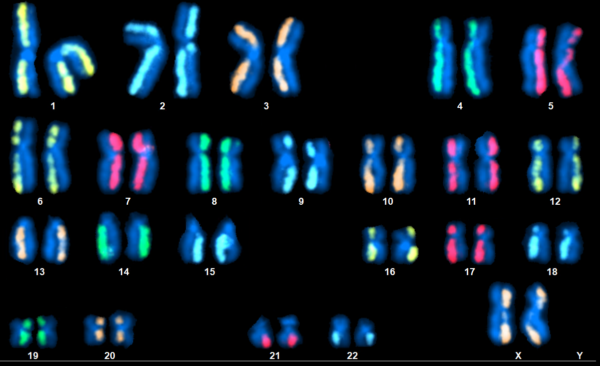
directional Genomic Hybridization (dGH) is a technique which has no problem with inversions. Daughter-strands are stripped from each dsDNA chromatid in a chromosome and fluorescent probes are designed against only one of the two remaining parent-strands. These unidirectional probes are termed dGH probes and SCREEN employs a full set of 24 whole-chromosome dGH paints, as seen in the title image. This resembles mFISH in that a karyogram is produced which showcases a full set of painted chromosomes, but only one side of each has color. Inversions are easy to spot as a result, appearing as fluorescence which has relocated to the unpainted chromatid. The assay can detect other rearrangement types like translocations, deletions, and more complex variants. Additionally, SCREEN has a lower limit of detection which varies by target region but can be as low as 10 kilobases.
Many in the biotechnology arena appreciate the value of orthogonal, confirmatory data sets. Sequencing data itself can serve that role when cytogenetic assays are the methods used first. In addition, a more inexpensive or quick assay can be used to take an initial, untargeted look at the genome, after which a different method may be used to look more closely at loci the first assay identified as suspect. There is no “best” technology any more than a hammer is “better” than a wrench. They are complementary and powerful tools in the scientist’s toolbox.
References
- Bailey, S. M., Cross, E. M., Kinner-Bibeau, L., Sebesta, H. C., Bedford, J. S., & Tompkins, C. J. (2024). Monitoring genomic structural rearrangements resulting from gene editing. Journal of Personalized Medicine, 14(1), 110. https://doi.org/10.3390/jpm14010110