Fluorescence In Situ Hybridization (FISH) is a molecular genetics assay which is often employed alongside G-banding (Giemsa banding) for detection and characterization of genomic aberrations. However, FISH is a more time-consuming and labor-intensive procedure. It requires greater expense in equipment and reagents for sample processing, as well as in additional hardware for imaging. Despite these barriers, the resolution advantage of FISH makes it possible to study much smaller features. The limit of detection of FISH is measured in kilobases while G-banded karyotyping cannot detect changes smaller than 5 megabases, even at high band resolution which can be very technically challenging to achieve with certain sample types. While DNA sequencing resolves aberrations down to single bases, low-level abnormalities can numerically slip by unnoticed. Meanwhile, G-band karyotyping and FISH both scrutinize single cells, one at a time. The result is that FISH-based assays occupy something of a middle ground, improving resolution but retaining the advantages of data based on individual cells.
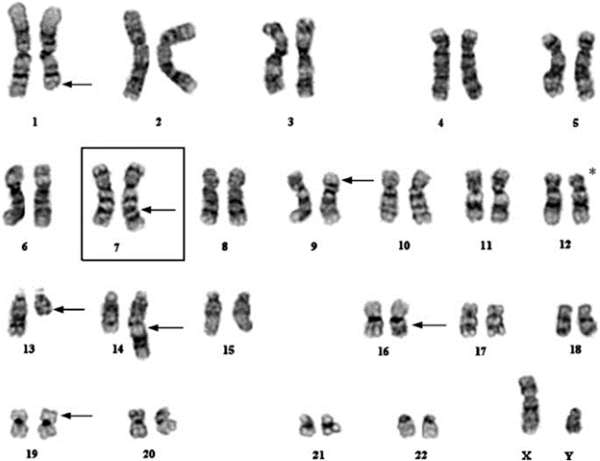
Figure 1. G-banded karyotype showing a cryptic translocation between chromosomes 12 and 19. (Zhong, Prima, Liang, et al. 2008)
Figure 1 highlights the challenge where G-banding alone is used. This complex karyotype features multiple chromosomes involved in a number of rearrangements. Fully automated, accurate analysis of G-banded chromosomes by artificial intelligence systems has not yet been achieved, so humans perform the work. At best, existing systems assist in segmenting and sorting chromosomes. In a complex abnormal such as in figure 1, one risk is that small aberrations can be missed. Fortunately, the humans performing this analysis did not fail to notice the small, dark band on the top of one of the chromosome 19’s. However, the assay itself did fail because G-banding lacks the ability to resolve the other half of that rearrangement. FISH confirmed the dark material is present on chromosome 19 as a result of a translocation with chromosome 12. The G-band analyst was resigned to calling it an “add(19),” meaning additional material of unknown origin. Subsequent FISH detected chromosome 12 as the translocation partner[1].
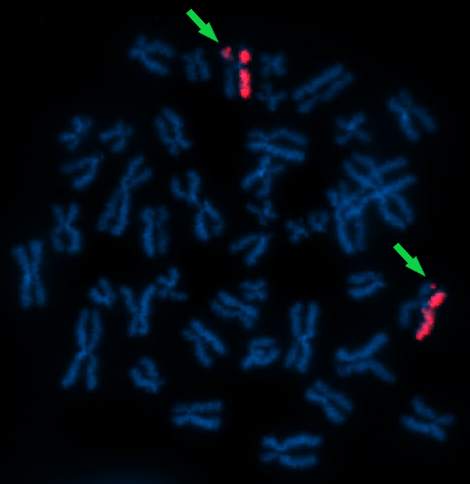
Figure 2a. dGH™ SCREEN paint probe labeled with Atto 550 targeting chr7 in metaphase cell from lymphoblastoid cell line. Two rearrangements are indicated by arrows. (KromaTiD, Inc. 2023)
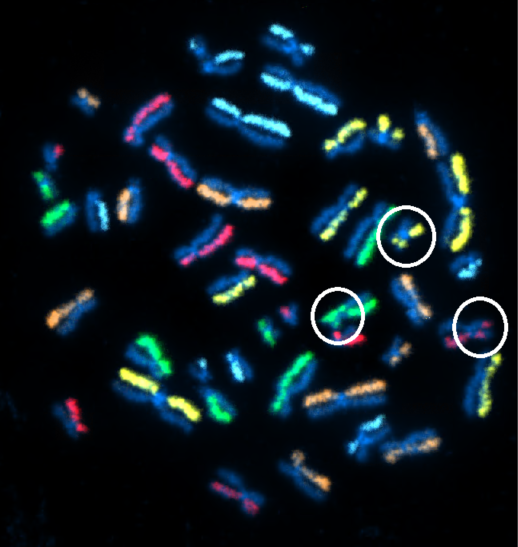
Figure 2b. dGH™ SCREEN detecting multiple structural rearrangements in metaphase cell from lymphoblastoid cell line. (KromaTiD, Inc. 2023)
Modern derivatives of the legacy FISH platform, such as directional Genomic Hybridization™ seen in Figure 2a and 2b, have enabled researchers to detect changes down to the single-digit kilobase range, even revealing whether a sequence resides on the positive or the negative DNA strand.
G-banded karyotyping certainly offers an efficient, informative and relatively economical genomic analysis option. Additionally, because G-banding has been in use for decades and so much scientific literature already exists around it, regulatory bodies such as the FDA may require G-banding be performed for a product’s approval as a matter of course. However, other technologies have continued to advance in the meantime.
References
- Zhong, C., Prima, V., Liang, X. et al. E2A-ZNF384 and NOL1-E2A fusion created by a cryptic t(12;19)(p13.3; p13.3) in acute leukemia. Leukemia 22, 723–729 (2008). https://doi.org/10.1038/sj.leu.2405084
- KromaTiD, Inc. (2023). dGH™ SCREEN. Figures 2a and 2b.